t-Test
The example can teach you how to perform a t-Test in Excel. The t-Test is used to test the null hypothesis that the means of two populations are equal.
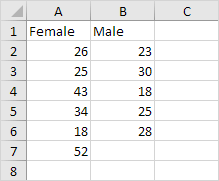
Below you can find the study hours of 6 female students and 5 male students.
H0: μ1 - μ2 = 0
H1: μ1 - μ2 ≠ 0
H1: μ1 - μ2 ≠ 0
To perform a t-Test, execute the following steps.
1. First, perform an F-Test to determine if the variances of the two populations are equal. This is not the case, because two populations are not equal here 😊.
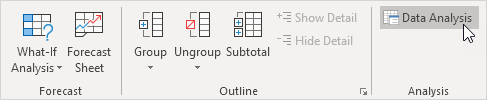
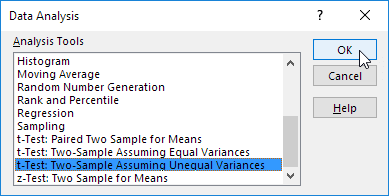
2. On the Data tab, in the Analysis group, click Data Analysis.
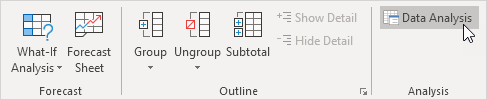
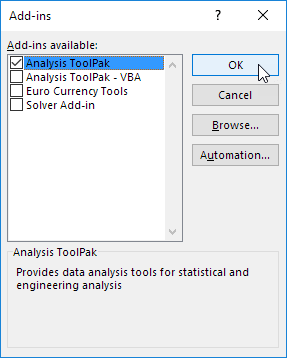
Note: can't find the Data Analysis button? Click here to load the Analysis ToolPak add-in.
3. Select t-Test: Two-Sample Assuming Unequal Variances and click OK.
4. Click in the Variable 1 Range box and select the range A2:A7.
5. Click in the Variable 2 Range box and select the range B2:B6.
6. Click in the Hypothesized Mean Difference box and type 0 (H0: μ1 - μ2 = 0).
7. Click in the Output Range box and select cell E1.
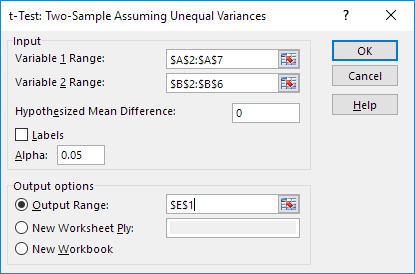
8. Click OK.
Result:
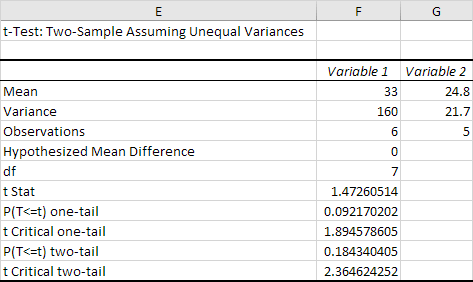
Conclusion: We do a two-tail test (inequality). lf t Stat < -t Critical two-tail or t Stat > t Critical two-tail, we reject the null hypothesis. This is not the case, -2.365 < 1.473 < 2.365. Therefore, we do not reject the null hypothesis. The observed difference between the sample means (33 - 24.8) is not convincing enough to say that the average number of study hours between female and male students differ significantly.